Threat Log
The Threat Log in the CyberGuard Dashboard of the WP500 Gateway provides a detailed and comprehensive record of all detected security threats. This critical feature allows administrators to monitor, analyze, and respond to various security incidents effectively. By reviewing the Threat Log, users can identify patterns, assess risks, and take necessary actions to secure the system against potential threats.
Key Information in the Threat Log
The Threat Log includes essential details about each detected threat, allowing users to gain a deeper understanding of security events and make informed decisions about threat mitigation. Here are the key data points captured in the Threat Log:
|
Field |
Description |
|
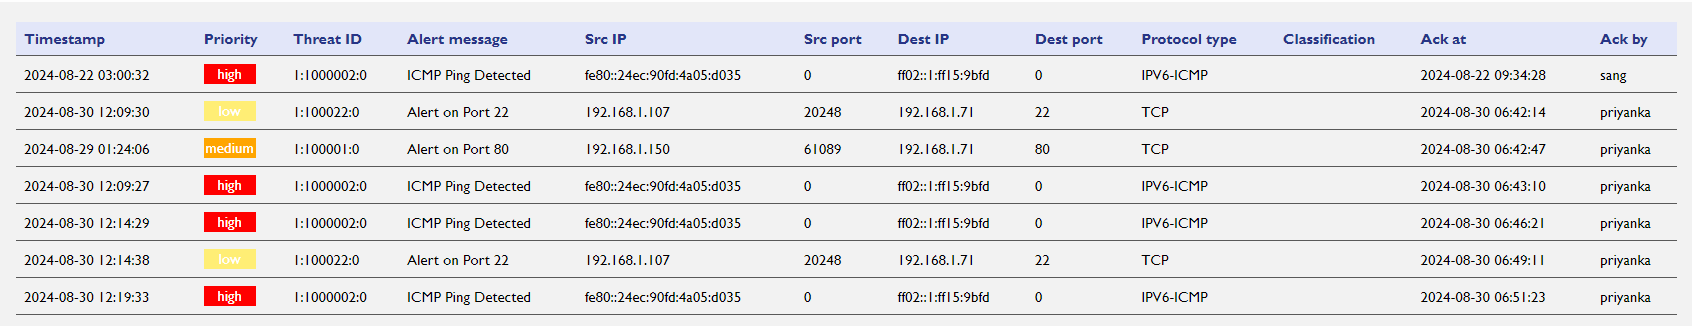
Timestamp |
The exact time when the threat was generated, providing a timeline for when the incident occurred. |
|
Priority |
The threat's assigned priority level (e.g., Low, Medium, High), indicating the potential risk it poses to the system. |
|
Threat ID |
A unique identifier assigned to each detected threat for easy reference and tracking. |
|
Alert Message |
A description of the threat, providing additional context or details about the nature of the security risk. |
|
Source IP |
The IP address from which the detected threat originated. |
|
Source Port |
The port number associated with the source from which the threat was initiated |
|
Destination IP |
The target IP address that the threat is attempting to compromise or impact. |
|
Destination Port |
The port number associated with the destination |
|
Protocol |
The type of network protocol used in the threat, such as TCP, IPv6, or others. |
|
Acknowledge |
A button that allows users to acknowledge the threat, marking it as reviewed or addressed. |
The Threat Log entries are displayed in a table, making it easy for users to review and analyze the information. Each row in the table represents a unique threat, and the columns correspond to the fields mentioned above.
 Procedure to Check Threat Logs:
To access and review the Threat Log in Cyberguard, follow the steps below:
- Click on the CyberGuard > Threat Log menu in the WP500 web interface.
- Choose the starting date in the From Date field and the ending date in the To Date field. This will define the timeframe for which you want to retrieve threat log data.
- Click the Load Threats button to initiate the retrieval of threat logs within the specified date range.
Once the threat logs are loaded, the system will display the log entries in a table format.