CPU Metrics
The CPU Metrics section in the WP500 Gateway provides crucial insights into the device’s processor and memory usage. Monitoring these metrics offers several advantages that contribute to the efficient operation, performance optimization, and overall management of the WP500 system.
Key benefits of utilizing CPU metrics
|
Fields |
Description |
|
Performance Optimization |
Detailed metrics such as system load average and available processors help in assessing how well the system is handling current workloads, enabling adjustments to optimize performance. |
|
Memory Utilization |
Metrics related to RAM, such as used memory, available memory, and buffer cache, help administrators manage and allocate system resources more effectively. |
|
Resource Allocation |
Understanding shared memory and free memory assists in making informed decisions about resource allocation to ensure optimal system operation and prevent resource depletion. |
|
Identifying Issues |
Metrics like CPU load average and memory usage provide valuable information for diagnosing system issues. High load averages or unusual memory usage patterns can indicate underlying problems that require attention. |
|
Monitoring Resource Usage |
Efficient monitoring of CPU and memory usage helps ensure that system resources are not being misused or overutilized, which is crucial for maintaining security and compliance with organizational policies. |
|
Detecting Anomalies |
Unusual patterns in CPU or memory usage can indicate potential security threats or unauthorized activity, allowing for early detection and response. |
|
Active User Monitoring |
Tracking the number of active users and their tasks provides insights into system usage patterns and helps in managing user activity effectively. |
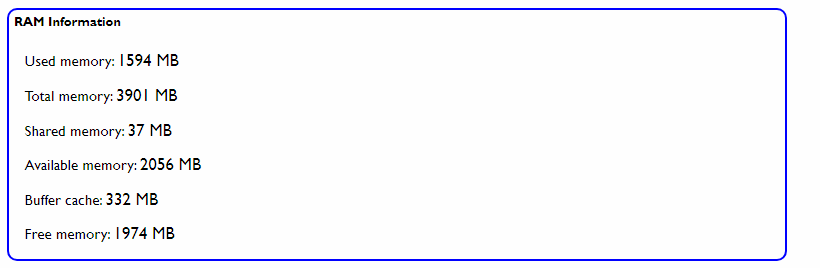
RAM Information:
|
Sr. No. |
Fields |
Description |
|
1. |
Used Memory |
This metric shows the amount of RAM currently being utilized by the system. Monitoring used memory helps you understand how much memory is being consumed by active processes and services. High memory usage could indicate that the system is running resource-intensive tasks. |
|
2. |
Total Memory |
Displays the total installed RAM on the WP500 device. This provides an overview of the device's overall memory capacity, which is crucial for planning and resource allocation. |
|
3. |
Shared Memory |
Refers to the portion of RAM that is shared among multiple processes. Shared memory allows different processes to collaborate by sharing resources, and observing this metric helps you assess how efficiently the system manages shared resources. |
|
4. |
Available Memory |
Shows the amount of RAM that is currently available for use. Keeping an eye on available memory ensures that there are sufficient resources for both ongoing and upcoming processes. A low value might indicate potential memory constraints. |
|
5. |
Buffer Cache |
Reflects the amount of RAM allocated for buffer caching. Buffer cache enhances system performance by storing frequently accessed data, allowing for faster retrieval. Monitoring this metric helps you evaluate how well the system is utilizing memory for performance optimization. |
|
6. |
Free Memory |
This represents the unused and available RAM. Free memory indicates the system's ability to handle new tasks or unforeseen demands. Ensuring that there is enough free memory helps prevent potential system slowdowns or crashes. |
By regularly monitoring the CPU Metrics section, administrators can effectively manage memory usage, identify potential issues, and optimize the performance of the WP500 Gateway.
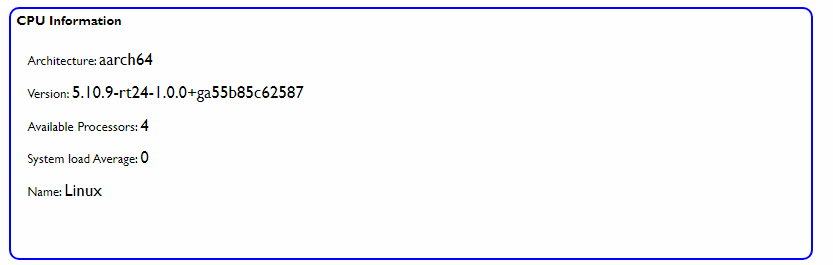
CPU Information:
The CPU Information section of the WP500 Gateway provides crucial details about the device's processor, including its architecture, version, and performance metrics. Understanding these details can help administrators optimize system performance and troubleshoot potential issues. Below is an overview of the key CPU metrics:
|
Sr. No. |
Fields |
Description |
|
1. |
Architecture |
Specifies the CPU architecture. This field provides insights into the underlying architecture of the CPU, such as x86, ARM, or other variants, which can affect software compatibility and system performance. |
|
2. |
Version |
Indicates the CPU version. This information details the specific version or model of the CPU, offering further insights into the processor’s capabilities and features. |
|
3. |
Available Processors |
Illustrates the number of available CPU processors. This metric shows the total count of processors (or cores) available on the system, which directly impacts the device's ability to handle parallel processes and multitasking. |
|
4. |
System Load Average |
Presents the system's load average. This metric provides a numerical representation of the system’s workload over a specified time period (e.g., 1 minute, 5 minutes, or 15 minutes). It reflects how heavily the CPU is being utilized and helps in assessing whether the system is under strain or operating efficiently. |
|
5. |
Name |
Displays the name of the CPU. This field shows the identifier or name of the CPU, offering additional details about the processor hardware, which can be useful for support or documentation purposes. |
By monitoring the information provided in the CPU Information section, administrators can ensure that the WP500 Gateway is running efficiently, understand the hardware specifications, and make informed decisions regarding system performance and maintenance.
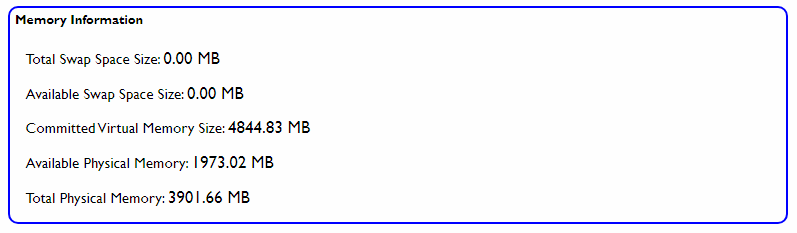
Memory Information:
The Memory Information section of the WP500 Gateway provides detailed metrics related to both physical and virtual memory usage. Understanding these metrics helps ensure that the system has sufficient resources to handle its operations efficiently. Below is a breakdown of the key memory metrics:
|
Sr. No. |
Fields |
Description |
|
1. |
Total Swap Space Size |
This metric refers to the total amount of swap space allocated on the disk, which the system can use as virtual memory when physical RAM is fully utilized. Swap space acts as an overflow for RAM, and its size is measured in bytes. |
|
2. |
Available Swap Space Size |
Available swap space indicates the remaining portion of the allocated swap space that is not currently in use. This metric provides insights into the system's virtual memory capacity and helps gauge the system’s ability to handle additional memory demands. |
|
3. |
Committed Memory Virtual Size |
Committed memory virtual size reflects the total amount of virtual memory that has been reserved for the system's processes. This value indicates the system's commitment to providing memory to running processes, even if that memory has not yet been fully utilized. |
|
4. |
Available Physical Memory |
Available physical memory shows the amount of RAM that is currently free and not in use by the system or applications. This metric is important for determining how much immediate physical memory is available for use by new or additional processes. |
|
5. |
Total Physical Memory |
Total physical memory represents the total installed capacity of the system's RAM. This metric reflects the sum of all physical memory modules installed in the WP500 and is measured in bytes. |
By regularly reviewing the Memory Information section, administrators can monitor the system's memory usage and ensure that the WP500 Gateway has adequate resources to maintain optimal performance.
Task User Information:
The Task User Information section provides insights into user activity and system processes on the WP500 Gateway. This information helps administrators monitor the number of active users and the tasks they are executing on the system. Below are the key metrics:
|
Sr. No. |
Fields |
Description |
|
1. |
Number of Users |
This metric shows the current count of users actively interacting with the system. It includes both local and remote users who are logged in and performing operations. Example: If three users are currently logged in, the "Number of Users" metric will display "3." This helps administrators keep track of user activity and system load. |
|
2. |
Task Details |
The "Task Details" section provides a detailed breakdown of the active tasks initiated by users. This includes information on the processes and applications currently running on the system. Monitoring task details is essential for understanding how system resources are being utilized and for troubleshooting performance issues. |
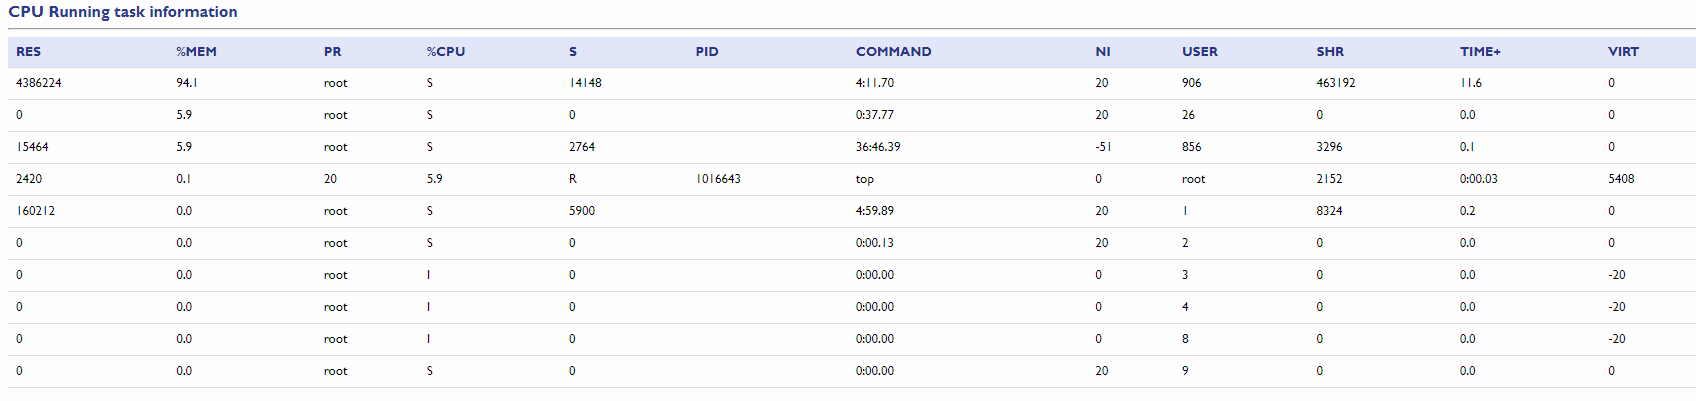
CPU Running task Information:
In the CPU metrics section, you can access essential system-related information about currently running tasks. This provides insights into the system's performance, memory utilization, CPU usage, and specific details about active processes.
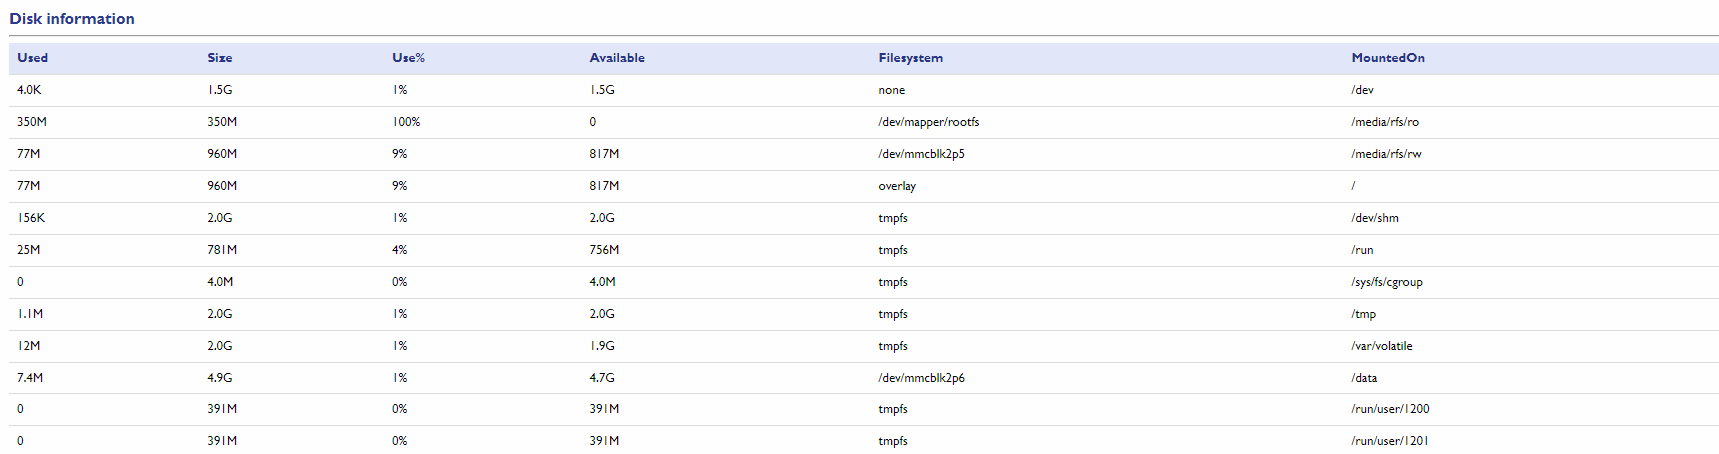
Disk Information:
In the CPU metrics section, the system-related information of Disk Information is presented with the following key parameters like used,size,use in %, Filesystems.