Soft oscilloscope
The soft oscilloscope enables you to track the value of boolean or numerical variables and display it in a curve. Spied variables are tracked by the Runtime Service, which detects changes and assign time stamps so that the trend displayed is very accurate.
The soft oscilloscope is available during Online debugging. It uses the T5 spontaneous protocol (used for binding) over ETHERNET. Thus the soft oscilloscope cannot be used with Runtime Service systems having no ETHERNET connection.
The soft oscilloscope is run from the Workspace window. Use commands of the contextual popup menu to create new soft scope configurations. Below is the soft oscilloscope screen:
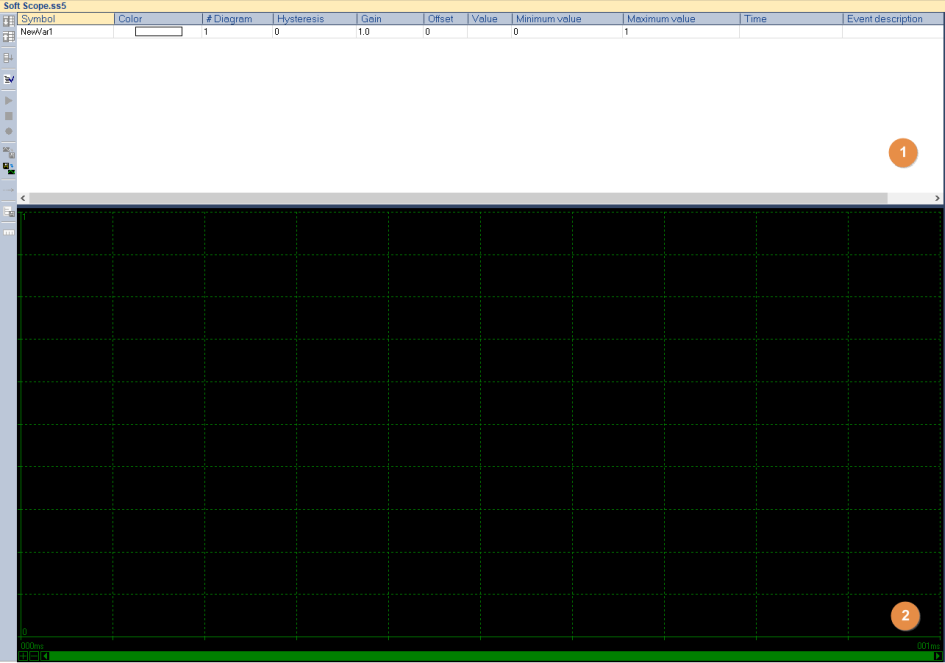
- List of variables to be displayed.
- Diagram area (oscilloscope display).
In the diagram area, the user can zoom, explore a particular time range and automatically scroll the diagrams.
The scroll bar behind, represents the current watching time range. The complete width represents the full time since target has started to the current target time.
To add new symbols to be displayed in diagrams, drag and drop them from the variable window, or double-click in an empty line in the list area. These new symbols can be added in both Online or Offline modes.
The following pieces of information are configured in the list:
|
Parameter |
Description |
|
Symbol |
Name of the spied variable. |
|
Color |
Color used to draw the curve. |
|
#Diagram |
Index of the diagram pane - default is 1. |
|
Hysteresis |
Hysteresis to apply for change detection of analog values. |
|
Gain |
Multiplication factor for the variable value, to display it. Example: If the variable is equal to REAL#4800.0 and the gain is 0.001, then the displayed value in the Soft Scope will be REAL#4.8. Hint: The Gain is used to display the variable only and has no impact on the variable itself. |
|
Offset |
Value to be added to the variable which will be displayed. Example: If the variable is REAL#4.8 and the offset it 10, then the displayed value in the Soft Scope will be REAL#14.8. Hint: The Offset is used to display the variable only and has no impact on the variable itself. |
|
Value |
The current value of the variable is refreshed in this column. |
|
Minimum/Maximum value |
Range of the Y axis. |
|
Time |
Time and date of the last change. |
|
Event description |
Free description text. |
The following commands are available from the soft oscilloscope toolbar:
|
Command |
Description |
|
Move Down |
Move the selected variable down in the list. |
|
Move Up |
Move the selected variable up in the list. |
|
Sort Symbols |
Sort variables of the list. |
|
Setup Curves |
Setup time ranges. |
|
Start Sampling |
Start the oscilloscope. |
|
Stop Sampling |
Stop the oscilloscope. |
|
Record sampling from now |
Start recording. |
|
Save selected diagramms |
Save record to the file. |
|
Restore diagrams |
Reload record from file. |
|
Enable/Disable Autoscroll |
Auto-scroll mode (toggle). |
|
Create a test sequence with selected diagrams |
Creates a test sequence with the selected diagrams. |
|
View status bits... |
Opens the View status bits dialog, if a variable is selected and the Soft scope is started. |
When sampling is active, you can start recording all events from now by clicking on corresponding (red) button. You must specify a csv file where samples will be recorded. All events on all symbols will be recorded in this file until you uncheck recording by clicking the button again.
When sampling is inactive, you can save particular parts of the diagrams to the disk. For this, will select the symbol(s) in the list and then zoom the time area to fit the range you want to save. Selected events will be saved in a .rec file. Later, you can restore a .rec file to the diagram. When user restore his diagrams, only symbols existing in the list will be updated.
The Setup button opens the following box for configuring the X-axis of the display:
Two modes are available:
- Zoom mode
- Autoscroll mode
You can choose a specific time area to be displayed with from and to lines. Buttons near are used to zoom from the first start time and to the current time.
In autoscroll mode, diagrams are scrolled automatically at the refresh rate to display the specified time range. The refresh rate can be increased for better refresh in autoscroll mode (for instance if the time range is long and if there lots of events occur during this period).
|
Other topics in this chapter |
Soft oscilloscope |
|
IEC 61131-3 Automation platform > IEC 61131-3 Programming Environment > Running the application > Soft oscilloscope |
|
|
Created with the Personal Edition of HelpNDoc: Transform Your Documentation Workflow with HelpNDoc's Intuitive UI