Graphic objects
The Graphics view allows the usage of predefined graphical symbols from a Graphic Library like Analog buttons, Bar Graphs, Binarys, Bitmaps and so on.
Select the desired symbol in the Properties area and use the drag&drop functionality to move the graphic into the main window.
The graphics can be modified and exported or saved to the Graphical Library.
Predefined graphics are collected in the following nodes:
- Analog buttons
- Bar Graph
- Binary
- Bitmap
- Charts
- Combo
- Embedded HMI (Simulation only)
- LED Displays
- Links
- Meters
- Miscellaneous
- MultiBitmap
- Scale
- Shapes
- Switches
- Text
Hint: A click on the desired node opens the preview of the corresponding graphical objects at the bottom. The size ratio of the nodes tree view and the preview is saved and is available again the next time the preview is opened.
Below are available basic objects you can insert in your graphics:
Basic shapes

A collection of basic drawings is available. Each object may be either static, or linked to a variable used to enable its visibility (show/hide).
Properties
- Identifier
- Aspect
- Variable symbol
- Spying delay
- Border size
- Border color
- Data format
- Color when not connected
- Background color
- Background mode
- Text
- Text color
- Text mode
- Font name
- Font size
- TRUE color
- FALSE color
- Direction
Bitmaps and MultiBitmaps
Bitmap file (BMP, GIF, JPG) can be inserted in the graphic area.
Properties
- Identifier
- Border size
- Border color
- Border style
- Background color
- Background mode
- Text
- Text color
- Text mode
- Font name
- Font size
- Pathname
- Bitmap display mode
|
|
|
Large bitmaps are time consuming during animation and can lead to poor performances, mainly if they have the STRETCH display mode or the TRANS (transparent) background mode. |
Scales
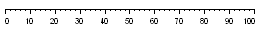
Scales are static drawings representing a X or Y axis, generally used to document other objects such as trend charts or bargraphs.
Properties
- Identifier
- Border size
- Border color
- Border style
- Background color
- Background mode
- Text
- Text color
- Text mode
- Font name
- Font size
- Minimum value
- Maximum value
- Direction
- Placement
- Nb divisions (main)
- Nb divisions (small)
- Scale color
Text boxes

Static, animated or edit text boxes are available for displaying / forcing variables. For edit boxes at Runtime Service, double-click on the object to enter the value and then hit ENTER to validate the input.
Properties
- Identifier
- Variable symbol
- Spying delay
- Border size
- Border color
- Border style
- Data format
- Background color
- Background mode
- Text
- Text color
- Text mode
- Font name
- Font size
- Action
Switches and 2-state displays
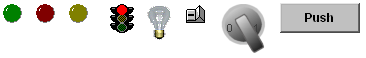
Buttons, switches and 2-state displays are used for control or display of a boolean variable.
Properties
- Identifier
- Aspect
- Variable symbol
- Spying delay
- Border size
- Border color
- Data format
- Data color
- Background color
- Background mode
- Text
- Text color
- Text mode
- Font name
- Font size
- Action
- Pathname for TRUE state
- Pathname for FALSE state
- Graduations of the Rotary Switch
- Bitmap display mode
Analog buttons
Analog buttons are used for setting the value of an integer or real variable. Mouse is used for setting the value.
Properties
- Identifier
- Variable symbol
- Spying delay
- Border size
- Border color
- Border style
- Data format
- Data color
- Background color
- Background mode
- Text
- Text color
- Text mode
- Font name
- Font size
- Minimum value
- Maximum value
- Scale color
Bargraphs

Bargraphs are rectangles filled according to the value of an analog variable. Bargraphs can be horizontal or vertical.
Properties
- Identifier
- Variable symbol
- Spying delay
- Border size
- Border color
- Border style
- Data format
- Data color
- Background color
- Background mode
- Text
- Text color
- Text mode
- Font name
- Font size
- Minimum value
- Maximum value
- Direction
Trend charts
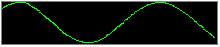
Trend charts enable the tracing of a variable as with an oscilloscope.
Properties
- Identifier
- Aspect
- Variable symbol
- Spying delay
- Border size
- Border color
- Border style
- Data format
- Data color
- Background color
- Background mode
- Text
- Text color
- Text mode
- Font name
- Font size
- Minimum value
- Maximum value
- Nb of points
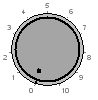
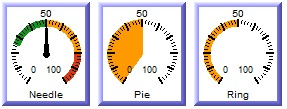
Analog meters
Analog meters provide a graphical display of an analog value.
Properties
- Identifier
- Variable symbol
- Spying delay
- Border size
- Border color
- Border style
- Data format
- Data color
- Background color
- Background mode
- Text
- Text color
- Text mode
- Font name
- Font size
- Minimum value
- Maximum value
- Scale color
- Nb divisions (main)
- Nb divisions (small)
Sliders

Sliders are used for entering an analog value with a horirontal or vertical mouse driven cursor.
Properties
- Identifier
- Variable symbol
- Spying delay
- Border size
- Border color
- Border style
- Data format
- Data color
- Background color
- Background mode
- Text
- Text color
- Text mode
- Font name
- Font size
- Minimum value
- Maximum value
- Scale color
- Direction
Digital meters

Digital meters (digits) display the value of a variable with the same aspect as a digital clock.
Properties
- Identifier
- Aspect
- Variable symbol
- Spying delay
- Border size
- Border color
- Border style
- Data format
- Data color
- Background color
- Background mode
- Text
- Text color
- Text mode
- Font name
- Font size
- Minimum value
- Maximum value
Links
![]()
Links are mouse driven hyperlinks that are used as shortcuts for opening another graphic document. Using links enable the design of multi page animated applications.
Properties
- Identifier
- Border size
- Border color
- Background color
- Background mode
- Text
- Text color
- Text mode
- Font name
- Font size
- Link
Connection status
Connection status is a box actuated with the current status of the connection and the connected Runtime Service application. It is aimed for diagnostic.
Properties
- Identifier
- Spying delay
- Border size
- Border color
- Border style
- Data format
- Data color
- Background color
- Background mode
- Text
- Text color
- Text mode
- Font name
- Font size
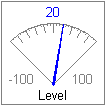
Gauge
Analog view meter.
Properties
- Needel color
- Identifier
- Variable symbol
- Spying delay
- Border size
- Border color
- Border style
- Data format
- Data color
- Background color
- Background mode
- Title
- Title color
- Title placement
- Font name
- Font size
- Minimum value
- Maximum value
- Nb divisions (main)
- Nb divisions (small)
Other properties
- Needle aspect: defines how the dynamic area must be shown (see bitmaps)
- Background bitmap: optional bitmap to be displayed as background
- Needle X/Y position: start position from the center of the image (percents)
- Needle size: needle with (percents)
- Needle angle: angles for min/max values in degrees
- Green color: color for the "low" range
- Green to: maximum "low" value
- Yellow color: color for the "medium" range
- Yellow to: maximum "medium value
- Red color: color for the "high" range
- Red to: maximum "high" value
- Value placement: where the text value should be drawn
- Set Gain/offset
Graphic objects |
|
IEC 61131-3 Automation platform > IEC 61131-3 Programming Environment > Running the application > Using the watch window for graphic monitoring > Graphic objects |
|
|
Created with the Personal Edition of HelpNDoc: Leave the tedious WinHelp HLP to CHM conversion process behind with HelpNDoc